|
|
POLICE AND SHERIFF REPORTER “The eyes & ears of the community” |
|
|
POLICE AND SHERIFF REPORTER “The eyes & ears of the community” |
We are using these old statistics to
point out how long these conditions have affected these S.F. neighborhoods and
communities. We will focus on other cities and cultural problems associated
with language barriers to obtaining gainful employment.
Considering the California Institute of Mental Health (CIMH) profiles of TANF recipients and DHS statistics, we expect the following client profile:
· 91% single-parent families headed by women, with an average of two children in each family.
· 30 - 40% of recipients/clients having substance abuse and/or mental health problems.
In fact, about 50% of TANF families are headed by a single parent; most are woman between the ages of 25 and 55 with an average of two children. In San Francisco and across the USA this constitutes a large “Domestic Nation of Poverty” comparable to many third world and emerging world countries.
“...India,
Hungary, Russia, The Philippines and other poorer nations are discovering in
software a lucrative industry that requires the one resource in which they
are rich: an under-employed, [creative, competent] labor force.”
Scientific
America, “The Crisis in Software Development”, Sept. 1994
While San Francisco has a citywide per-capita income envied by others, our minority populations fall well below the city average.
Per
Capita Income by Race/Ethnic Group
(1990
Census)
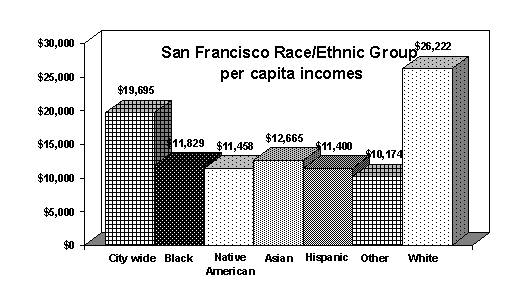
The
“Minority Majority City” per capita incomes.
San Francisco, was number 13 in “Money” magazine’s 1996 survey “Best Places to Live”, but continues to neglect its under served communities. Isolated in housing projects in Hunter’s Point, Potrero Hill, North Beach, Ingleside, Sunnydale and the Western Addition.
Chart.2:
San Francisco City population by Race/Ethnic group
(1990
Census)
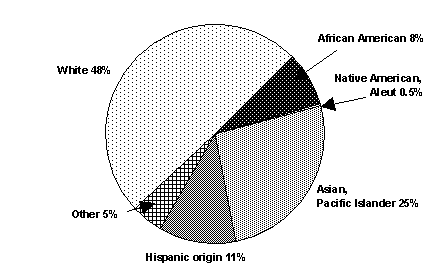
Chart
3: San Francisco Poverty population by Race/Ethnic group
(1990
Census)
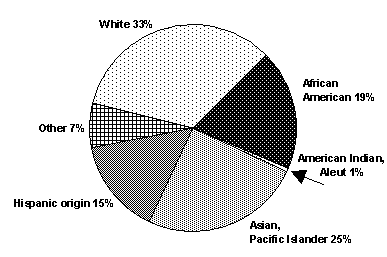
San Francisco’s future is largely dependent on today’s youth. Yet today’s minority youth are an overwhelming percentage of youth living below the poverty line (1990 Census of Population & Housing, Dept. of City Planning). More alarming, African American Youth are, 14% of the youth population, make up 50% of juveniles committing crimes.
Chart 4.4: Status of Youth
S. F. Youth population Youth in Poverty Youth in Crime
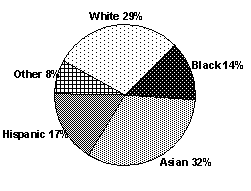
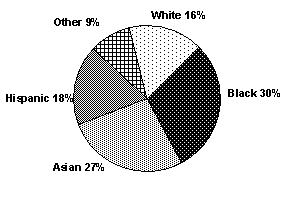
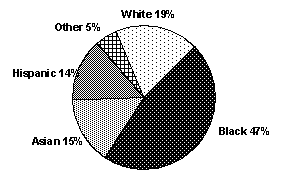
When
asked what he wants to be when he grows up, a San Francisco Black youth
replied:
“I
don’t know if I’ll be alive, so I don’t think about it.”
RSN will provide families of inner-city youth the means and opportunity of “Breaking the Cycle of Poverty without breaking the Law.” With proper training this will allow underserved communities to participate in the American Dream, by achieving economic success, without breaking the law, risking their lives, their freedom, or their futures.
In San Francisco, public housing tenants are (74%) African American, (83%) are single parents with minor children, and have a per-capita income of $2,770 in contrast with the citywide per-capita income approximating $20,000 (Table 4.1, below). In other words, we are ‘warehousing’ low-income single mothers and their children with little to no hope for escape.
Table
4.1: San Francisco Housing Authority Tenants Profile (1992)
|
Family
Characteristic |
Public
Housing |
City
Wide |
|
Percent Single Parents with Minors |
83% |
5.8% |
|
Average Household Income |
$9,138 |
$45,600 |
|
Average Number of Family Members |
3.3 |
2.27 |
|
Average per capita Household Income |
$2,770 |
$20,000 |
|
Percentage of AFDC recipients |
54.6% |
10.3% |
|
High School Drop-Out Rate |
13.0% |
1.5% |
|
Preschoolers to Young Adults (0-24
years) |
67% |
33% |
|
Racial/Ethnic
Origin Composition |
||
|
African American |
74.6% |
10.9% |
|
Asian |
5.3% |
29.1% |
|
Hispanic |
9.3% |
13.9% |
|
Other |
6.3% |
7.5% |
|
White |
4.5% |
53.6% |
The US has a long tradition of warehousing low-income single mothers with dependent children.
This practice of warehousing low-income women in housing projects benefited both the areas’ economy and women themselves in the 1940’s when women became a primary labor source for local US defense companies. Today’s low-income women may be equally valuable to local business as trained computer users, receptionist, retail clerks, nurse’s aides telemarketing associates, or advertising sales persons. RSN Training will create platoons of knowledge workers ready to take their places in government and commercial establishments throughout the Bay Area. Not every person has the skills or learning ability to make it in the technology field, so that is all the more reason to create jobs that people without the education can still earn a livable wage. Below is the actual welfare appendix from 1997. In a future article we will present the latest statistics and that is evidence of the ongoing problems. We need to fix the system to keep it from draining the economy any further.
APPENDIX
I: STATISICAL REFERENCES
TANF Statistics (August 1997 sample data)
|
# Single Parent families |
7455 |
|
# 2 Parent families |
1948 |
|
Total families |
9403 |
GENDER BREAKDOWN OF CHILDREN AND ADULTS ON TANF
|
Gender |
Single
Parent Families |
2-Parent
families |
||
|
Children |
Adults |
Children |
Adults |
|
|
Female |
51% |
90% |
50% |
50% |
|
Male |
49% |
10% |
50% |
50% |
NUMBER OF CHILDREN ON TANF
|
Age |
In
Single parent families |
In
2-parent families |
||
|
# |
% |
# |
% |
|
|
0-1 |
1534 |
12.1% |
469 |
10.9% |
|
2-5 |
3363 |
26.5% |
1000 |
23.2% |
|
6-10 |
3769 |
29.6% |
1192 |
27.6% |
|
11 |
610 |
4.8% |
222 |
5.1% |
|
12 |
612 |
4.8% |
231 |
5.4% |
|
13-17 |
2827 |
22.2% |
1204 |
27.8% |
|
Total |
12,715 |
100% |
4318 |
100% |
ETHNIC BREAKDOWN OF TANF CASELOAD
|
Ethnicity |
In
Single parent families |
In
2-parent families |
||
|
|
# |
% |
# |
% |
|
African American |
47.1% |
115 |
5.9% |
|
|
Asian |
1625 |
21.8% |
1165 |
59.8% |
|
Caucasian |
794 |
10.7% |
124 |
6.4% |
|
Hispanic |
1258 |
16.9% |
230 |
11.8% |
|
Russian |
174 |
2.3% |
268 |
13.8% |
|
Other |
93 |
1.2% |
46 |
2.3% |
|
Total |
7455 |
100% |
1948 |
100% |
GENDER
AND AGE BREAKDOWN OF TANF POPULATION
|
Gender |
In
Single parent families |
In
2-parent families |
||
|
|
# |
% |
# |
% |
|
Female |
5563 |
90% |
1884 |
50.4% |
|
Male |
583 |
10% |
1856 |
49.6% |
The numbers above are real and the problem still exists in 2004. We need to stop paying attention to foreign problems and start repairing our own economy. Politicians promote how much they are going to do if elected. I see no changes or fixes in these problems and it’s time we take action to help fix our own problems. With your help we can make a difference and make our neighborhoods safer place’s to live and do business.
If you know someone who is having trouble with drugs or alcohol, remember the 24-hour hotline number is 1-888-USE-NONE
© 2004 - 2007 Recovery Survival Network
All rights reserved.